Author: WarrenD

  • Carlos Sainz and the Surprising Sadness of Second Place

    At the start of the 2021 Formula 1 season, Ferrari had a mountain to climb.

    Despite being one of the most well-funded and prestigious teams on the grid, they’d massively underperformed the previous year. Well, they were doing great, until… ahh, how shall I put it… a “potential irregularity” was discovered in how their engine was operating (others might say “They got caught cheating”).

    After this came to light, regulations were changed, engine adjustments were made – and then Ferrari’s performance dropped massively. They went from being one of the top 3 teams, to being just a middling one.

    This whole situation probably caused sleepless nights for a lot of people. But I’d wager none more than Carlos Sainz Jr.

    Picture of Calros Sainz Jr.
    Carlos Sainz Jr. at McLaren

    You see, 2021 would be Sainz’s first season at Ferrari. He’d moved there from McLaren, a British team experiencing quite the opposite turn of fortune in 2020 – previously middling, McLaren were now on the ascendancy, and were in contention to take Ferrari’s spot as the number 3 team on the grid.

    It seemed like Sainz had jumped ship… right onto one that was sinking.

    So you’d think, that if Sainz managed to finish in second place for Ferrari, he’d be ecstatic. This would be true of any race, but especially if it happened in Monaco, the most glamorous event of the calendar. Not only would it be a great personal achievement, it would suggest that perhaps Ferrari weren’t a sinking ship after all.

    So why, on May 23 2021, after he did finish second at Monaco, did Sainz describe the result as “Bittersweet”?

    This isn’t the first time that second place has been a source of sadness for Sainz. It happened previously in Monza 2020, when Sainz was still at McLaren. He was in second place and chasing down the leader, getting closer every lap… but unfortunately for him, he couldn’t get past.

    You can hear the radio chatter between Sainz and his engineer in those final laps of that race here (his comments start at 1:19).

    Not a happy chappy, is he?

    To put that Monza race in perspective, finishing fifth or sixth would have been a good result in that McLaren car at that time. To finish second was an incredible result. If you’d offered him that before the race weekend, he’d have bitten your hand off. He should have been over the moon, but he was disappointed. Why?

    Comparisons influence emotions

    A study published back in 1995 might have the answer. The idea is that the happiness we get from something isn’t based on an objective assessment of that thing. It’s based on what we compare it to.

    The researchers, Victoria Husted Medvec and Thomas Gilovich of Cornell, and Scott Madey of the University of Toledo, studied the happiness shown by medal winners of the 1992 Olympics. They had undergraduate students rate how happy each person looked in the medal ceremonies, and other footage from after the winners of the events were announced.

    If happiness was based on an objective assessment of circumstances, you’d expect gold medallists to be happiest, then silver, then bronze, right? But that’s not what they found.

    The gold medallists were happiness incarnate, as you’d expect. But weirdly, the bronze medallists were happier than the silver medallists. The reason for this might be what the athletes are comparing their results against.

    Top down map of the Monaco track
    The Monaco circuit – a source of both joy and sadness

    The silver sadness effect

    The researchers believe that when you win silver, you compare yourself to gold. You focus on the one single person in the whole entire world who beat you – rather than the billions of others over whom you just proved your superiority! This was clearly what was on Sainz’s mind after his second place finish at Monaco. As he said after the race:

    “You know, the bittersweet feeling is still there because I had the pace to put it on pole or at least to win this weekend, and the fact that in the end we didn’t quite manage, is not great.”

    The result was bittersweet because he’s changed his comparison point. Before the race fourth might have been a great stretch goal, and one he’d have been happy with. But due to a few mishaps, the fastest cars weren’t at the front where he expected them to be. Suddenly he found himself in second with a chance to win – and that became his new reference point. How he finished in relation to that reference point determined how he felt.

    The bronze bliss effect

    And why are the bronze winners apparently happier than the silvers?

    Perhaps it’s because they compare themselves downwards – not up. They are just happy to be up there on the podium, as part of the winner’s group – knowing that they were just one place away from not getting any recognition at all.

    This was clearly on the mind of Lando Norris of McLaren who finished third in Monaco, behind his former teammate Carlos Sainz. As Lando told Sky F1:

    “It’s incredible… it’s a long race, especially with Perez the last few laps, that pressure of seeing him in my mirrors after every corner. It’s stressful… I don’t know what to say! I didn’t think I’d be here today. It’s always a dream to be on the podium here, so it’s extra special.”

    As you see here, he’s comparing himself to fourth placed Perez – and he’s extremely happy with the result.

    (It’s not the whole picture obviously)

    Now of course there’s more to the story than purely finishing second vs third. And it’s not like every single person who finishes third is happier than the person in second. There are loads of other factors at play, like:

    • Who else is competing. It’d be interesting to see if there’s a difference when competing against uber-champs – like if you’re swimming against someone like Michael Phelps, would you be happier with silver because you didn’t see yourself as really in the running for the gold? (or maybe elite athletes just don’t think that way).
    • Your relative standing in the pack – if you’re a huge underdog who’d never dream of finishing 10th, never mind second, it might make a difference.
    • Your history – if you’ve never had a podium/medal, then getting that under your belt will bring its own happiness
    • How close the content was. If the best competitor was way out in front, and the second and third best grappled hard against each other with fourth place way behind them, then that second place might feel sweeter.

    So you have to think that this silver sadness effect is just one part of a complex web of factors that influence how athletes feel after the content.

    That’s if it exists at all, of course – we’ve only discussed one study here (although another study of judo fighters found the same thing). Still, the general idea that comparison affects our happiness (as well as things like our preferences and perceptions), is more broadly supported (whether you want to call it the comparison trap, the contrast effect bias, or whatever).

    Anyway, I guess the practical application of this is, try to look down on other people as much as possible.

    Just kidding!

    The practical application I suppose would be something like deliberately expressing gratitude, or trying to become more aware of the good things and people you have in your life. I think that often, if we’re a little pissed off or annoyed, we’ve talked ourselves into that state by focusing on all the crap that went wrong.

    So sometimes – not always, but sometimes – we might be able to talk ourselves out of it too, by changing our comparison point. Although, it might not work when you have more serious problems going on, or when things are super meaningful to you (like a racing career you’ve dedicated your whole entire life to).


  • The “hot hand” in basketball – is it real, or just an illusion?

    If you’re writing about the hot hand, it’s compulsory to include an NBA Jam “He’s on fire” screenshot. I don’t make the rules.

    Let’s jump in our DeLorean go back in time – not to 1984, but 1985. And instead of picking up a copy of Grays Sports Almanac, we’ll grab a paper published by Gilovich, Vallone, and Tversky (GVT) that year.

    It’s called The Hand in Basketball – On the Misperception of Random Sequences, and it’s all about whether basketball players really have “the hot hand”.

    That is, do players hit a “hot streak” – a period of time where they’re playing better than usual, and they are more likely to successfully make baskets than they otherwise would be.

    Or, are such streaks just down to plain old-fashioned randomness?

    (I guess the title of the paper is a bit of a spoiler…)

    You cannot be serious

    Most people believe in the hot hand. And with good reason – think of all the evidence out there on how psychological states like flow and confidence can influence performance. This would all point in the direction of hot streaks being possible. Plus anyone who has ever played a sport or game has experienced a hot hand, a period of time where you’re just “on it”. And even if not, we’ve all seen examples of it on TV.

    Besides, we know that the “cold hand” is real. Players routinely have games, or parts of games, where they can’t seem to do anything right. It happens in every sport. Anything from missing an open goal, a hostile crowd, or a bad call from the umpire can put players on tilt, knock their confidence, and cause them to under-perform. So if there’s a cold hand, there’s gotta be a hot one too. It’s how the universe works, yin and yang and all that, right?

    Well here’s the counter-point. Take a completely random game like a coin toss. In a normal coin toss, with no tricks, you have no influence on the outcome. Yet, flip enough coins, and you’ll get some streaks. You might get 5, 6, or 7 heads in a row. And you might even feel like you’re doing it – maybe you’ll feel more confident, more focused, and “in the zone”.

    But ultimately, you’re being fooled by randomness. This is what Gilovich, Vallone, and Tversky argue happens during a basketball game. When players take enough shots during a game, they’ll get some streaks. And it will feel to them, and look to others, like a hot hand. But in reality, it’s just the ebb and flow of randomness.

    So, which idea is right?

    Comparison to randomness

    This is a surprisingly tricky thing to study. You’d need to make a comparison to a random sequence of numbers, and see if the players’ performances ever deviated from that.

    With a coin toss, this would seem relatively easy. You know the baseline probability is 50% per outcome, assuming there are no tricks at play. With basketball shots, the probability of a successful basket isn’t known. Plus it varies with every shot, depending on things like:

    • The skill level of the player
    • The skill level of the opponents
    • Where the shot was taken from
    • The type of shot
    • The fatigue level of the player
    • The mental focus of the player at that time
    • If the player was carrying an injury
    • How far into the game it was
    • Whether the player was under pressure at the time

    …and so on.

    So how would you actually work this out?

    How do you get to that baseline, the equivalent of the 50% probability for the coin toss? As we’ll soon see, this is a crucial question.

    Recent hits and misses

    One one hand, if hot streaks are real, then all this variation and noise shouldn’t matter too much. I mean, if they are real enough for people to recognise them, then they should appear in the data despite all that. So the first thing GVT did was just see if players were more likely to make a shot successfully after a previously successful shot (or series of them), or after a previous miss (or series of them).

    The baseline was established simply by working out the player’s hit to miss ratio overall. So they didn’t separate based on free throws, shots under pressure, timing, or anything like that. They did the old statistician’s trick of throwing it all in one bucket and just taking the average.

    Now here’s another important point to note – these tests were based on data from 9 players in the 48 home games of the Philadelphia 76ers in the 1980/81 season. So we’ve got only a small sample of players here (sports wasn’t as data-focused back in those days).

    Here are the overall probabilities they found:

    Hit after 2 misses: 56%
    Hit after 2 misses: 53%
    Hit after 1 miss: 54%
    Overall probability of a hit: 52%
    Hit after 1 hit: 51%
    Hit after 2 hits: 50%
    Hit after 3 hits: 46%

    As you see, these figures are the wrong way round to what you would expect if hot (and cold streaks) were real.

    A fallacy is born

    And thus, the “Hot Hand Fallacy” – the false belief that a successful outcome increases your chance of further successful outcomes – was born. The argument went as follows: The human brain isn’t a statistical computer, and it doesn’t understand randomness very well. So when it sees a string of random outcomes, it assigns agency to them, even though it’s really just noise.

    GVT’s idea did have its critics.

    “Is nothing sacred?”, Larkey, Smith and Kadane said in their 1989 critique of the fallacy.

    “Nope,” GVT effectively replied, in their convincing rebuttal.

    The results of GVT’s original study were replicated a few times. Plus the “T” in GVT is Amos Tversky, who would have won a Nobel Prize for his work on cognitive biases, had he not passed away in 1996 (his research partner, Daniel Kahneman, did receive the award). So, despite many doubters outside academia (people in the world of sports didn’t tend to believe it), and some hold-outs within the ivory towers, the hot hand was generally believed to be a fallacy, a cognitive illusion.

    And so things remained, for around 30 years or so. Until Joshua Miller and Adam Sanjurjo (let’s call them MS) came along.

    All about that base

    Never tell me the odds. (Photo by Joey Kyber)

    MS argue that the hot hand is real, streaks exist, and GVT simply made a mistake in their analysis. And the mistake, they argue, is an ironic one – it has to do with a misunderstanding of randomness.

    Let’s go back to that base rate probability I mentioned earlier. In the world of random coin flips, the probability of a head is always 50%. A previous flip of heads will have no bearing on any subsequent flip – so it’s always 50%.

    However, when you get outside the world of “standing there, coin in hand, ready to flip”, and into the world of “selecting a sample of flips from a previously completed sequence of coin flips,” your chance of selecting a head will only be 50% if:

    • The original coin flips were actually random (which again, we’re assuming here)
    • There is no bias in the way you select the flips

    MS argue, that selecting flips based on whether they follow a particular outcome (or series of outcomes) does introduce bias. In fact, if you look only at the outcomes that follow a flip of heads in a finite sequence of coin flips, the probability of getting another heads is actually lower than 50%.

    The more flips there are in the sequence, the closer to 50% it will be, but you still won’t actually get there.

    WTF?

    Yeah, that was pretty much my reaction too. But here’s how MS illustrate it:

    Let’s say you flip the coin three times. Is your chance of getting a heads higher in a flip, if you already got a heads in the previous flip? There are only a finite number of possible outcomes here, so we can work this out:

    HHH
    HHT
    HTT
    HTH
    TTT
    TTH
    THH
    THT

    First of all, the sequences TTT and TTH are of no use to us. In TTT there is no heads, and in TTH we got a heads, but it’s at the end of the sequence, so we can’t follow it with another coin toss (again – the fact that we’re looking back on a finite sequence of flips is introducing the bias – nothing MS are saying here has any bearing on how future coin flips with turn out).

    So, let’s take those two out. That leaves us with 6 sequences we can work with:

    HHH
    HHT
    HTT
    HTH
    THH
    THT

    The fact that we only have three flips in each sequence means that the last coin flip only useful as an outcome relative to the second flip. So we have 12 flips of interest here – the first two in each sequence.

    So, within each sequence, what are the odds that one of the initial two flips is a heads, which is then followed by another heads?

    Let’s see…

    Sequence Heads following heads Probability
    HHH 2/2 First two flips are heads, both followed by heads, so 2 out of 2, probability 1.
    HHT 1/2 First two flips are heads, one is followed by heads, so 1 out of 2, probability ½.
    HTT 0 First flip is heads, not followed by heads. Probability 0.
    HTH 0 First flip is heads, not followed by heads. Probability 0.
    THH 1/1 Second flip is heads, is followed by heads. Probability 1.
    THT 0 Second flip is heads, but not followed by heads. Probability 0.

    Since we’re assuming pure randomness, each of these sequences is equally likely to happen. That means we can simply take the average of each of these probabilities to get the overall probability that a heads will follow a heads:

    (1 + ½ + 1) / 6 = 2.5/6 or 5/12 if you don’t like decimals in your fractions.

    That’s less than 50%!

    Small and large numbers

    This doesn’t mean that randomness suddenly stops working. It just means that when you have a finite sequence of flips, and you are not taking a random sample of them, but instead only the ones that follow a streak, you’re introducing sample bias into your analysis.

    If the sequence of numbers stretched out to infinity, the law of large numbers would take over and the probability would be 50%. But since you’re dealing with a sample, you don’t get that protection.

    When MS reanalysed the GVT data with this bias in mind, they did indeed find evidence for the hot hand. In fact, MS not only think the hot hand is real, they think it’s a bigger effect because of another form of measurement error that is common in studies of the hot hand (read more of MS’s thoughts here).

    And MS aren’t alone in this – a number of other researchers have chimed in with work supporting the idea that the hot hand is real, and not just a fallacy:

    Statistical hot hand versus psychological hot hand

    It’s also worth mentioning that in all these studies the researchers define a hot hand as a series of successful shot attempts. This makes sense statistically, but it probably doesn’t represent the psychological reality of having a hot hand.

    Would your hot hand immediately go cold if you missed a single shot? Probably not. Also, if you have the hot hand, would your newfound confidence lead you to take more difficult shots, in situations when you’d probably play safer if you didn’t have the hot hand? It might be that the sequence of scores is interrupted not because the player lost their hot hand, but because they tried something a little fancy out.

    With all the data in sports these days, that’s something you can actually test for, and the study from 2014 I mentioned earlier did indeed find that players who were performing above their average tended to attempt more difficult shots in open play. And this study concludes that there’s evidence for the hot hand – but only after controlling for shot difficulty.

    Time could be important too. These studies don’t take the time that each shot was taken into account – and when we’re talking about a psychological state, this seems pretty crucial! Take the following sequence of shots:

    101010101

    Statistically, there is no streak here, no hot hand. But imagine this sequence of shots happened in the space of a short space of time, and the player wouldn’t ordinarily hit 5 baskets in that time span. Could that not be called a hot hand? If you only define the hot hand in terms of hits in a row, it clearly isn’t. But the player might be running rings around the other team, and getting into shooting positions more easily. If you define the hot hand in terms of hits within a given time period, they now start to look hot.

    One thing that doesn’t seem to be in dispute, is that players believe in the hot hand, and you might assume they’re more likely to give the ball to hot players. So you might also assume that defenders will try to crowd out hot players. In other words, a player could be hot in the sense that, whatever psychological and physiological changes relating to being hot are active, but this is not reflected in the hit/miss stats because the opposing defence is wise to them. Interestingly, that same 2014 study which found hot players taking harder shots also found that hot players face tougher defence. This is another reason that “hotness” wouldn’t show up if you only look at hit streaks, yet they could still be having an important influence on the game by drawing defending players towards them, and opening up space elsewhere.

    Yet another aspect of timing that might be relevant is the breaks in the game. For example, does a hot hand carry over between halves, quarters, or after time outs (or is it more or less likely to)? Should you start a streak from scratch at these points, or allow them to continue?

    So, we’re 30 years into this and we still have a lot of open questions. What do you think, is the hot hand real?

  • Beyond money: towards an economy of well-being (Diener and Seligman, 2004)

    Beyond Money: Towards an economy of well-being is a 2004 paper by Ed Diener and Martin Seligman. Here are the key points.

    Overview

    Economic indicators like GDP and the employment rate are dominant when it comes to making policy decisions. Such statistics are important and relevant, especially when it comes to the fulfilment of basic needs – wealthier countries are more likely to provide food, shelter, and security to their citizens. However, economic indicators have a number of of shortfalls. Not only do they fail to provide the full picture of well-being in a society, but in some respects they may actually be misleading in that regard.

    Economic indicators should be balanced out with a wider range of statistics that give a clearer picture of how well a society is flourishing. These include well-being and mental health measurements, social capital, and human rights.

    Not only will this give governments a better idea of how to create effective policies, but improvements in these non-economic indicators will likely lead to improved economic performance in any case.

    Details

    A number of countries have developed their own national well-being index. The EU runs regular surveys measuring well-being, the UK introduced well-being measures under David Cameron’s government, and Bhutan was a trail-blazer in this regard.

    A lot of this has to do with psychologists putting a lot more effort into studying happiness around the turn of the century. A paper in 2004 by Ed Diener and Martin Seligman entitled “Beyond Money: Towards an Economy of Well-Being” summed up the research that was available at that time, making a case for such well-being indices.

    Here’s an overview of the key points in the paper.

    Key argument

    Economic measures give an incomplete and sometimes inaccurate indication of how well a society is flourishing. Policy makers should make the development of valid well-being measurements a priority, and use the data to inform policy.

    What is well-being?

    Psychologists define well-being as people’s “positive evaluations of their lives”, taking everything into account. These evaluations are affected by things like the amount of positive emotion people experience, how engaged they are in what they regularly do, how satisfied they are with their life situation, and how much meaning they get from their lives.

    More info on how happiness is measured here.

    What’s wrong with economic indicators then?

    They have their uses, of course, but they are perhaps over-used. The news tells you how the economy is doing every day. How often do they tell us how satisfied, engaged, or depressed people are?

    And what’s the point of a strong economy anyway? Ultimately, it’s to improve well-being – at least to a large extent. In many ways, then, economic indicators are a stand-in for happiness.

    That makes some sense. The richer you are, the more options you have. The easier you can meet your basic needs like food, shelter, and warmth. And the more options you have in general in your life.

    Centuries ago, when these basic needs were not as well met as they are today, a concern with the economy made a lot of sense. But today, we’ve basically got that covered.

    That’s not to say we should throw them all out. It’s just that they don’t correlate as strongly with well-being as they perhaps once did.

    For example, Diener and Seligman argue that in the 50+ years before the paper was published in 2004, GDP had increased steadily. At the same time, however:

    • Measures of well-being had remained relatively flat
    • Rates of depression had increased 10-fold
    • American children experience more anxiety
    • The amount of social connections people have had decreased
    • People report less trust in both other people and governments

    So why not measure and report on well-being directly?

    Limitations of measures of well-being

    But it’s not all rosy in the world of well-being measurement. There are some problems here too.

    • Multiple constructs: researchers measure different “forms” of well-being: satisfaction, positive emotion, negative emotion, depression – these are not necessarily equivalent.
    • Single answer questionnaires: a lot of well-being research just asks one question (How happy are you on a scale of 1-10?). The researchers argue that these are less reliable.
    • Data is usually cross-sectional: This basically means a measurement taken at one time. It’s better to measure the same people over time to track trends.

    They argue that we need more carefully thought-out measures, perhaps even different measures used with different populations (e.g., a different questionnaire for teenagers than adults receive).

    Relevant findings in well-being research

    Diener and Seligman then go on to summarise some of the relevant well-being research that could be relevant to policy decisions.

    National wealth and well-being

    There is a correlation between the two – richer countries tend to be happier. However, Diener and Seligman argue that there are diminishing returns – after around $10k GDP per capita, money makes much less of an impact.

    Governance and well-being

    Human rights correlate with well-being, as you’d expect. But since richer countries tend to have better human rights on average, it’s hard to say how much of an impact they have by themselves.

    Democracy, and greater involvement in the political process, also predict well-being.

    The perceived effectiveness and trustworthiness of governments was correlated with well-being.

    Political stability is also important, and in the short-term can be more important than the impact of having a democratic government system at all.

    Social capital

    Social capital in a society means high levels of trust and helping between people.

    Community boosts well-being – this can mean volunteering, club memberships, church attendance, and people socialising in general. Basically whenever people get together with positive intentions towards each other.

    Trust in a society is linked to higher well-being and lower suicide rates. Recent studies (at the time: 2004), showed declining trust in the United States.

    Religion and well-being

    Religious people tend to be happier than the non-religious, on average, both across and within nations

    Church attendance plays a role here – religion ties into the social capital effect.

    Money and well-being

    Higher income is linked to well-being, but it’s a slightly more complex situation than the mere correlation implies.

    Generally speaking, the poorer the country, the stronger the correlation. For example in the US, the correlation is .13 – it exists, and when we’re talking about policy decisions affecting 300 million people, it matters. But it’s not worth writing home about (about 1.7% of the variance in well-being accounted for by income).

    In the slums of Calcutta, however, the correlation is .45 (about 20% variance explained).

    Again, this probably comes down to the basic needs issue I mentioned earlier.

    The correlation probably goes both ways, also – a number of studies show that happier people do better in the workplace:

    • Job satisfaction and positive meed contribute to productivity
    • Happier employees change jobs less often and take less time off
    • Happier employees are more helpful and have better work relationships
    • The well-being of employees can predict customer satisfaction

    More on the impact of happiness on work success here.

    Materialism and well-being

    Also, there might be a negative impact of income on well-being. When people put too much focus on money and material possessions at the expense of other values, they may experience lower self-esteem and well-being.

    More on materialism here.

    Physical health and well-being

    Well-being correlates with health, not surprisingly. Better health means higher well-being.

    However, people tend to adapt to health conditions, and once they are used to them and able to cope, their well-being moves towards where it was before they got the health condition, sometimes all the way. However that’s not always the case, especially with illnesses that affect daily life, or which are/could be terminal.

    As with money, the health link might also work both ways, to some extent.

    • Lifespan is longer in countries with higher well-being and optimism
    • The outcome of certain illnesses can be predicted by well-being measures, especially optimism
    • People with higher well-being tend to report feeling less pain
    • Well-being measures are linked to better immune responses

    More on the link between happiness and health here.

    Mental health and well-being

    As noted earlier, mental health problems in wealthy countries had been increasing, even though they were becoming wealthier.

    Depression, in particularly, had increase 10x in the 50 years before the study was published. This is despite much better GDP, better living conditions, the internet, more music and pop culture, better education, and other benefits.

    This is the point of a well-being index – economic measures don’t capture this fact. If you used them alone, you’d thing everything was fine.

    A few more points. At the time of this study, Diener and Seligman (2004, remember) reported that:

    • 50% of a national sample had experience at least one mental disorder in their lifetime, 30% in the last year, and 18% in the last month
    • 16% of young adults in a British study were classed as having a neurotic disorder
    • Depression is the third highest cause of loss of “quality adjusted lifespan” (ie taking into account the life in the years, not just the years in the life). Behind only arthritis and heart disease, and higher than cancer and diabetes.

    Social relationships and well-being

    The need to belong is a psychological need, and when we don’t have positive, supportive people in our lives, we tend to feel very bad. The quantity and quality of our relationships are among the best predictors of an individual’s well-being. This was very well established by the research even back in 2004.

    Of course, economic indicators of progress miss the impact of social relations completely. In fact it can be worse – when policies are made with only economic indicators in mind, the outcome back be worse relationships.

    Some social indicators do exist – crime rates, marriage/divorce rates, gender equality and so on, but they don’t capture the full picture of the amount and quality of relationships that people have.

    Systems of Indicators

    Economic indicators clearly aren’t doing their job in terms of being adequate gauge of societal well-being.

    A number of other large scale well-being surveys are out there, carried out by the EU, Gallup, and others. But these aren’t quite there either.

    So what’s the answer?

    Well, it’s probably not a single indicator, but a system of them. Which covers a range of different variables, using a range of methodologies.

    For example, a wide-scale cross-sectional survey, combined with a subsample studied using the Experience Sampling Method (basically buzzing people in their phones a few times a day to ask how they feel, rather than giving them one big questionnaire at a single point in time).

    Such a system of indicators would have to:

    • be policy-focused
    • fairly represent all stakeholder groups in a nation
    • Include broad and narrow aspects of well-being
    • Have a set batch of questions that remain stable over time (to allow long-term comparisons), as well as shorter-term scales that can be added and removed as needed

    The authors didn’t discuss the specific variables that should be included in such a survey, and left that as a topic for another day.

    Well-being instead of money?

    The authors conclude by pointing out that we’re not getting rid of money anytime soon. It’s too entrenched into our culture, has a proven track record, and furthermore, well-being isn’t a panacea that’s going to come along and solve everything.

    One of the challenges will be finding a balance between the two – building economic stability without negatively impacting well-being in the process, and pursuing well-being without sacrificing the benefits that the money economy has brought.

  • The evolution of gratitude

    Photo by Tim Dennel

    We humans intuitively know how important it is to express gratitude. “Thank you” is one of the first phrases we teach our children, and it’s a key thing to learn when we visit a foreign country. There is part of us that would just feel really bad if we didn’t express gratitude when someone has done something for us (well, for most of us at least).

    Try going a week without saying “thank you” to anyone. Not your spouse, not a work colleague, not the barista at Starbucks. Imagine how uncomfortable you’d feel! Somehow we just know that this would be upsetting to others, and also bad for us too – we’d get a reputation for being rude, and people would be less likely to help us out in the future.

    Where did this strong instinct and understanding come from? Is it something we simply learn from a young age, and have drilled into us? Maybe, but some researchers think it’s an evolved trait – we’re simply born with a gratitude instinct.

    A paper from 2008 by Michael McCullough, Marcia Kimeldorf, and Adam Cohen called “An Adaptation for Altruism? The Social Causes, Social Effects, and Social Evolution of Gratitude” looked into this idea a bit.

    Gratitude: a prosocial emotion

    First, they define gratitude – it’s a positive emotion that comes when we feel we have benefited from someone else’s actions. The researchers label gratitude as a prosocial emotion – in other words, the whole reason it’s there is to nudge humans to act in prosocial ways.

    There’s a lot of research supporting this idea. One experiment was particularly clever. Researchers created a situation where some of there participants thought that they’d received some money from another participants. Other participants thought they got this money by random chance.

    Then, the participants were given some more money, and told that they could either keep it all themselves, or share it with their partner. As expected, the ones who thought they’d been gifted the money earlier were far more likely to share it in the second part of the experiment.

    When asked why they wanted to share the money instead of just keep it all for themselves, they simply said they wanted to express their thanks to the other person, and this was their way of doing it.

    So as we see, gratitude makes people kinder – at least, towards people who have already helped them in some way. We call this reciprocity – a fancy word meaning you scratch my back, I’ll scratch yours.

    Gratitude is everywhere

    So let’s get back to the topic of evolution.

    If gratitude was an evolved emotion, you’d expect to find it everywhere – and you do. Just as there’s no culture without anger, love, or joy, we haven’t found one without gratitude. But we can go back even further than that – some researchers have even looked for evidence of gratitude in animals.

    Now, this is very tricky to do. Is your cat grateful after you feed her? It’s easy to imagine that she’s happy about it, but grateful? Since cats can’t say “Thank you!”, how would you know?

    Well, it’s hard to say for sure. But one way is to think about the idea of reciprocity. In another study, researchers set up a food puzzle for chimpanzees, that couldn’t be completed alone – they needed help from another chimp. When watching them work on this puzzle, the researchers observed that chimps were most likely to help another chimp if that chimp had helped them out previously.

    Did the chimps do this because a feeling of gratitude compelled them? Who knows. Emotions are a common tool of evolution, used to nudge behaviour – so it’s certainly possible. But it doesn’t have to be. If the helping was nudged by an emotion, it might have come from a feeling of indebtedness, for example.

    Why would gratitude evolve?

    Another way of thinking though whether a particular trait is an evolved adaptation, is to consider, what’s the purpose of it?

    We have to be careful of just making up nice sounding evolution stories here, but with that said why might gratitude evolve? According to the Selfish Gene view of evolution, there would have to be a benefit to the genes that lead us to feel gratitude. MucCullough, Kimeldorf, and Cohen thought this boils back to the concept of reciprocity again.

    As a tribal species, we couldn’t survive on our own – we needed help from other people. This can lead to imbalances – what if you’re doing all the helping, but no one’s helping you? That wouldn’t be fun. Maybe you’ve had a job like that. On the other hand, if everyone’s helping you out, but you’re not lifting a finger to help anyone, then that’s fantastic for you (you’d be an arsehole, but it’s still good for you) and bad for everyone else.

    So, perhaps we’d evolve a way of balancing the books, so to speak. A way to know who we should be helping, and by how much. The researchers think gratitude might have been one part of the solution to this problem – that is, maybe it evolved to help facilitate fairer exchanges.

    If this was true, we’d expect two things. First, we’d expect the strength of the gratitude we experience to be proportional to the benefit we got. Second, we’d expect to feel more gratitude towards strangers than to people we’re related to.

    To the first point, this is something we know intuitively, but studies back this up too. One experiment was set up in a similar way to the money sharing one earlier – participants got a gift that they were told was from another person, and later had a chance to pay the giver back. This time, they varied the amount people received in the first place – people receiving larger gifts were more generous when they had a chance to repay the favour than those who received a smaller gift.

    To the second point, why would we expect to feel less gratitude towards relatives? It’s because we share genes with our relatives, and so there’s another system already “built in” to make sure we help them (according to a theory known as kin selection). So, gratitude doesn’t need to “switch on” as much to achieve helping between relatives (although it would help our relationships if we expressed it more often anyway).

    A study from way back in 1977 suggests there might be something to this, although this was based on hypothetical scenarios (basically just asking people, if a stranger or a relative helped you out, who would you be more grateful towards). So this study at least doesn’t give super-solid support for this point.

    So where does that leave us? Darwin had suggested that gratitude was a universal emotion, which other primates experience. We’re not quite at the point where we can say that’s true, but based on behaviour, so far it seems they at least experience something that does the same job.

    References:

    Bar-Tal, Daniel & bar-zohar, Yaakov & Hermon, & Greenberg, Martin. (1977). Reciprocity Behavior in the Relationship Between Donor and Recipient and Between Harm-Doer and Victim. Sociometry. 40,. 293-298. 10.2307/3033537.

    McCullough, M. E., Kimeldorf, M. B., & Cohen, A. D. (2008). An adaptation for altruism: The social causes, social effects, and social evolution of gratitude. Current directions in psychological science17(4), 281-285.

    Suchak, M., Eppley, T. M., Campbell, M. W., & de Waal, F. B. (2014). Ape duos and trios: spontaneous cooperation with free partner choice in chimpanzees. PeerJ2, e417.

    Tsang, Jo-Ann. (2007). Gratitude for Small and Large Favors: A Behavioral Test. The Journal of Positive Psychology. 2. 157-167. 10.1080/17439760701229019.

  • PredPol – Predicting crime through data mining

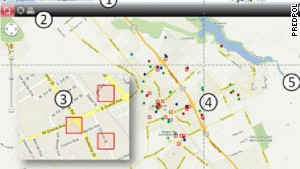
    Not too long ago in LA, crime was going up while the number of officers was going down. The LAPD had to try something different if they wanted to make a dent in this, so they looked to an anthropologist and mathematicians from UCLA, Santa Clara University, and UC Irvine.

    “PredPol,” mines vast amounts of crime data and predicts where crimes will occur. Unlike the “hot spot” system, which identifies crime-heavy areas, PredPol is updated in real time and gives predictions for the next 12 hours. Cops in LA would go to these “boxes,” sometimes as small as 500 feet square, just to make their presence known and look out for criminal activity.

    According to PredPol’s Proven Results page, the system was twice as effective as trained crime analysts. In the areas in which PredPol was tested, crime dropped by 13% while other areas showed a 0.4% increase.

    PredPol works because, although an individual’s behaviour is very difficult to predict, once you put people in herds the trends and averages become very apparent. If you know the factors that contribute to a certain behaviour, you can work out a probability of that behaviour occurring. The more factors you know and the more accurately you know them, the better your prediction will be.

    PredPol is being rolled out further, including the UK.

    It’d be interesting to see how far you can take this. If you imagine a day where PRISM style data mining is legal and totally accepted, and governments can access all data, then combine that with “quantified self” monitoring (it won’t be long before neuro imaging become cheap and portable enough to be the latest personal informatics tool), you could pretty much predict anything, couldn’t you?

  • Is obesity actually a marker for an underlying condition?

    There’s a swing in opinion happening. The current view of obesity is that it’s an effect of overeating. Obese people are largely considered to be at fault for their condition — if they’d only choose health over the pleasure of eating and sitting around, they’d cure themselves.

    I used to think the same thing, but my thoughts are slowly shifting too. The first step for me was thinking that junk food might be addictive, and that it’s a superstimulus, manipulating an evolved preference for sugar and fat. I started to see it more like drug addiction (though I’m aware that lots of people disagree and think that getting off drugs or alcohol is just a choice). Later I read books like “Why we get fat” which even argue that the cause of obesity and overweight is not simply overeating.

    Peter Attia talks frankly about his own shift of opinion, why he thinks the old view of obesity is wrong, and gives a few speculations on where he’s going to look for the actual cause.

  • Richard Feynman on thinking processes.

    Feynman said that there are no miracle people, and anyone can do what he did if they put their mind to it (my thoughts here). Yet there’s one domain in which Feynman clearly had a natural gift in — curiosity! This is exemplified by the little experiments he describes in the video below, where he learned how accurate his sense of time was and what things affected this sense. He’d count to a minute in his head and learn that when he got to 48, a minute had passed. Then he tested what else he could do while doing this, and he could read but not talk.

    At the end of the video he says “Now I’m starting to talk like a psychologist, and I know nothing about that!” Let’s test that theory. Here’s the video.

    For the lazy, when Feynman told mathematician John Tukey about this, Tukey could do the reverse — talk but not read. The reason was that Feynman would talk to himself in his head, while Tukey would see an image of a clock ticking over. Feynmann suggests this could be because people think differently, and if you’re having trouble getting a point across, it might be because what your saying is more difficult to translate into the other person’s favoured modality than it is your own.

    I don’t know if he’s right about that latter point, but he’s certainly right about the rest. We have multiple cognitive “modules” in the brain which are specialised to different functions, and it’s possible to bring different modules to bear on a task. For example, our working memory, which is the cognitive process in use whenever you’re consciously “doing” something (like Feynman’s counting task) has a number of different components. I discuss these here. Each of these components has limitations, but your brain can use all the components at the same time.

    When Feynman started counting in his head he was employing the phonological loop, and when counting lines in a book he’s using the visuo-spatial sketch pad. These are different “modules,” that’s why he could do both tasks at the same time. Talking uses the phonological loop, so when he tried that, he’s asking too much of the module (which in most people would be fully occupied by the counting) causing him to mess up on the task.

    For Tukey, the reverse is true. He visualised a clock, occupying the visuo-spatial sketch pad but leaving the phonological loop free. So he could talk freely but as soon as he tried to read, he messed up.

    Some experiments even take advantage of this fact, by having participants count out-loud as they perform some other task, so they occupy the phonological loop as they test some other cognitive module.

    It’s also true that different people have different preferences in terms of how the process information, and cultural differences play a big role in this. So at the end of the video, Feynman was being a little unfair on himself when he said he knew nothing about psychology!

  • Alan Wallace on scientific dogmatism and materialism

    Alan Wallace, a Buddhist and writer on consciousness and meditation, talks about what he sees as the dogmatism and idolatry of the current, materialistic scientific paradigm.

    While there are some questions about materialism that no one has been able to answer, I don’t agree that the focus materialism is a form of idolatry. It’s just the framework into which all the other empirical data best fits. If another model came along that fit the data better, or data came along that did not fit the model, the prevailing paradigm would change. It would change slowly I’m sure, because paradigms do, but it would change. It’s a bit unfair to talk about current scientific models as if they are not works in progress — even if they slow, perhaps too slow, to change.

    Since there’s a finite amount of time and money that can be invested into consciousness research, it makes more sense to start your investigations from the standpoint of the most supported, the most accepted and the most validated paradigm, which is the material model. So you start from here, you make assumptions from here and then test them. A difficult question then becomes, at what point do you know that you’ve exhausted all the avenues of this model, and should start looking to others?

    Wallace says that a better way to study consciousness is to use our immediate experience, through our own observations, because this is a direct experience of consciousness, unlike second-hand self-report or brain imaging data. But I don’t see how this can answer the fundamental question – whether consciouness emerges from matter, as the materialistic view proposes, or whether matter emerges from consciousness, as the Buddhist and other views propose. How would introspection answer that?

    Observing the mind might well let you understand it, it might show you, as Wallace describes, this blissful second “layer” of consciousness, which Wallace claims does not arise from matter. How is it possible to know this from introspection? If you answer “You have to experience it to know,” then that’s an argument to authority (to people who have already experienced it) and I won’t be convinced by that, but at the very least it’s testable and a million times better than “you must have faith.” That it takes years and years of meditation to test this hypothesis is somewhat inconvenient, but at least its falsifiable.

    But let’s say I do experience it. How do I know it does not arise from matter? How can introspection separate something that does not arise from matter and never did, from something that does but has changed through years of mental training?

  • Daphne Bavelier gives a nice overview of the cognitive benefits of video games

    If you’re familiar with the research on the cognitive benefits of video games, you can probably skip this one. If not, here’s a good way for you to spend the next 18 minutes, and maybe break a few preconceptions you might have about the usefulness of gaming. Daphne Bavelier talks about how playing action video games like Call of Duty and Black Ops can improve various cognitive capacities.

    I was particularly surprised by these two interesting facts on gaming in general:

    • The average age of a gamer is 33 (makes sense — in the 80s, games were played almost exclusively by kids. How old are those kids now?)
    • One month after the release of COD: Black Ops, the game had been played for 600 million hours. That’s 68,000 years.

    There are a few problems with this research though, which I discussed here.

  • Opinions on free will by Steven Pinker, Michio Kaku, Sam Harris, Dan Dennett, Richard Dawkins and Lawrence Krauss

    In the videos below, six academics give their views on the tricky concept of free will. It seems hard to reconcile the materialist view of reality with the idea of free will, since anything that happens in the brain to bring about a choice had a cause, and that cause had its own cause, all the way back to the beginning of time. Some of these scholars seem, to me, to redefine the concept of free will in order to hold on to it. But see what you think:

    Steven Pinker – Skirts the question a bit:

    Michio Kaku – Rejects determinism, but seems to suggest that uncertainty or randomness is a form of free will:

    Sam Harris – Says it’s an illusion:

    Dan Dennett – It exists:

    Richard Dawkins and Lawrence Krauss – It’s an illusion, though it doesn’t make much difference: